Visualizing Evolving Trees
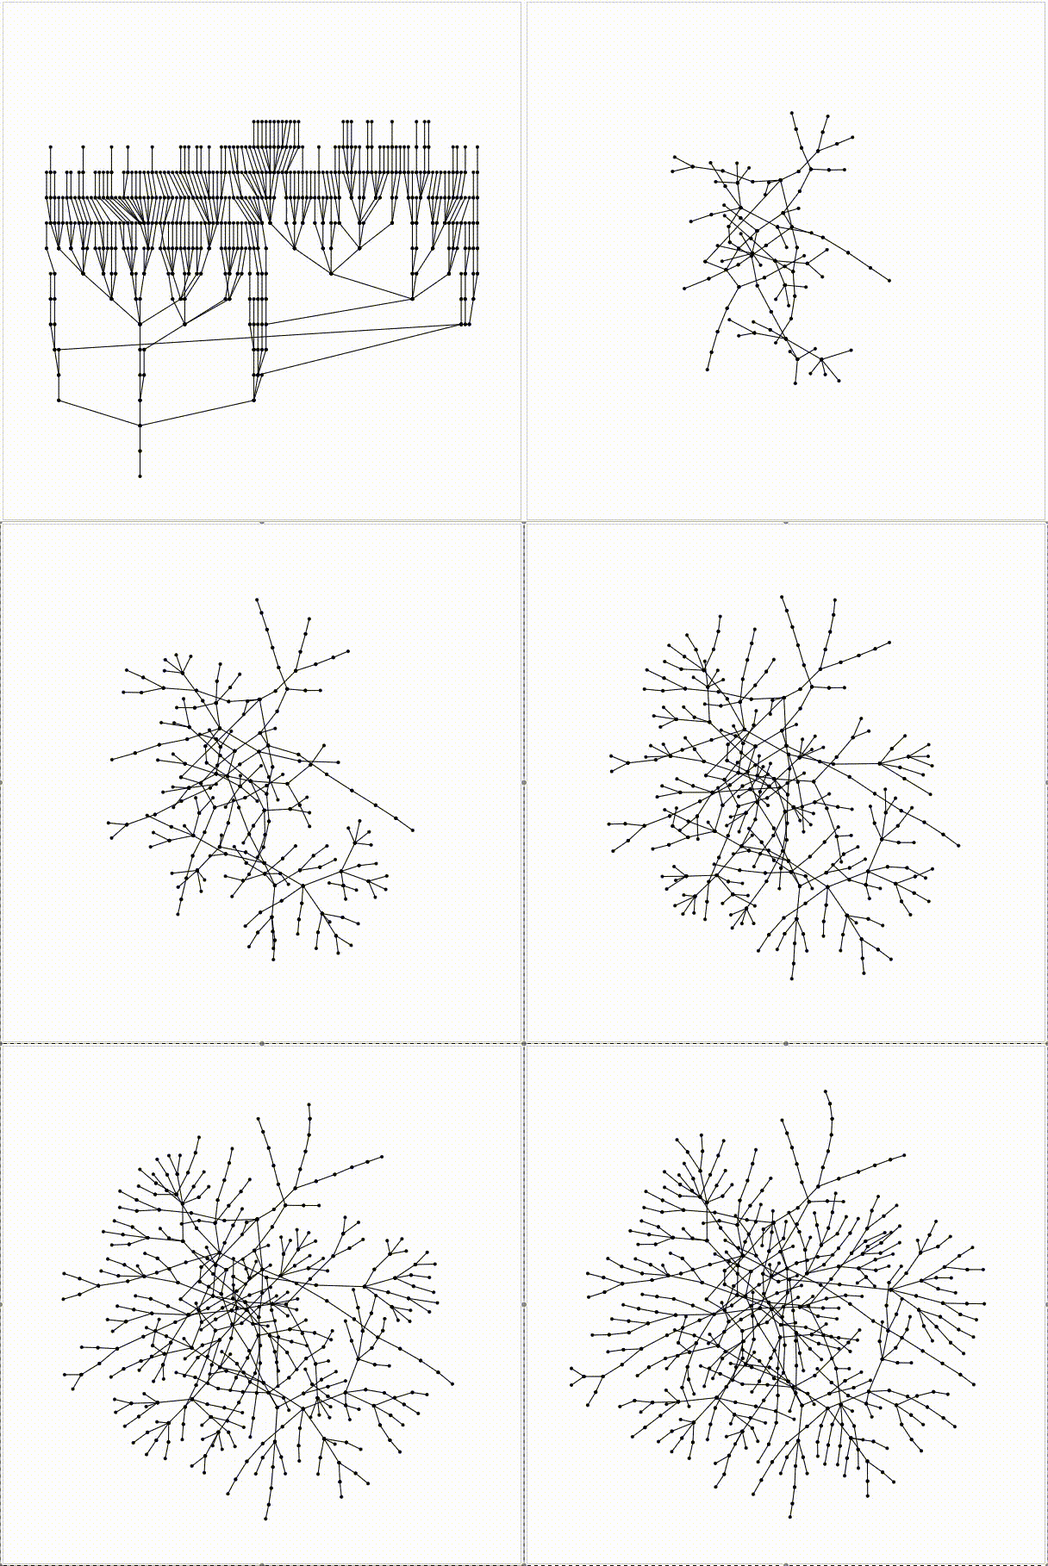
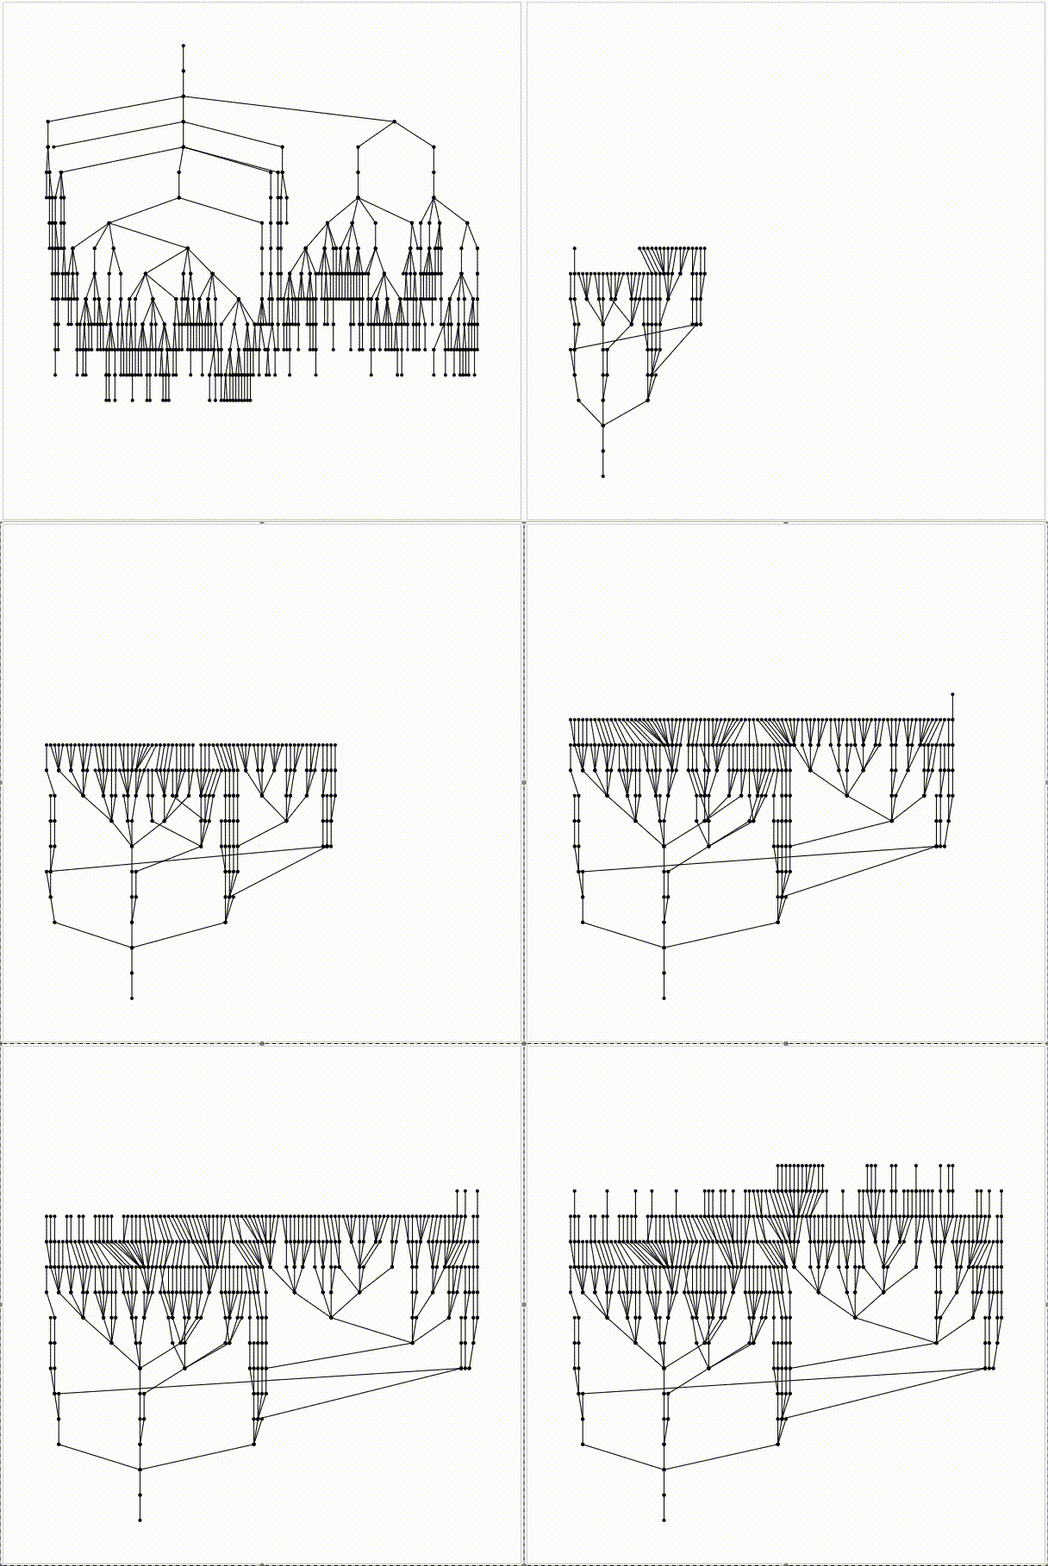
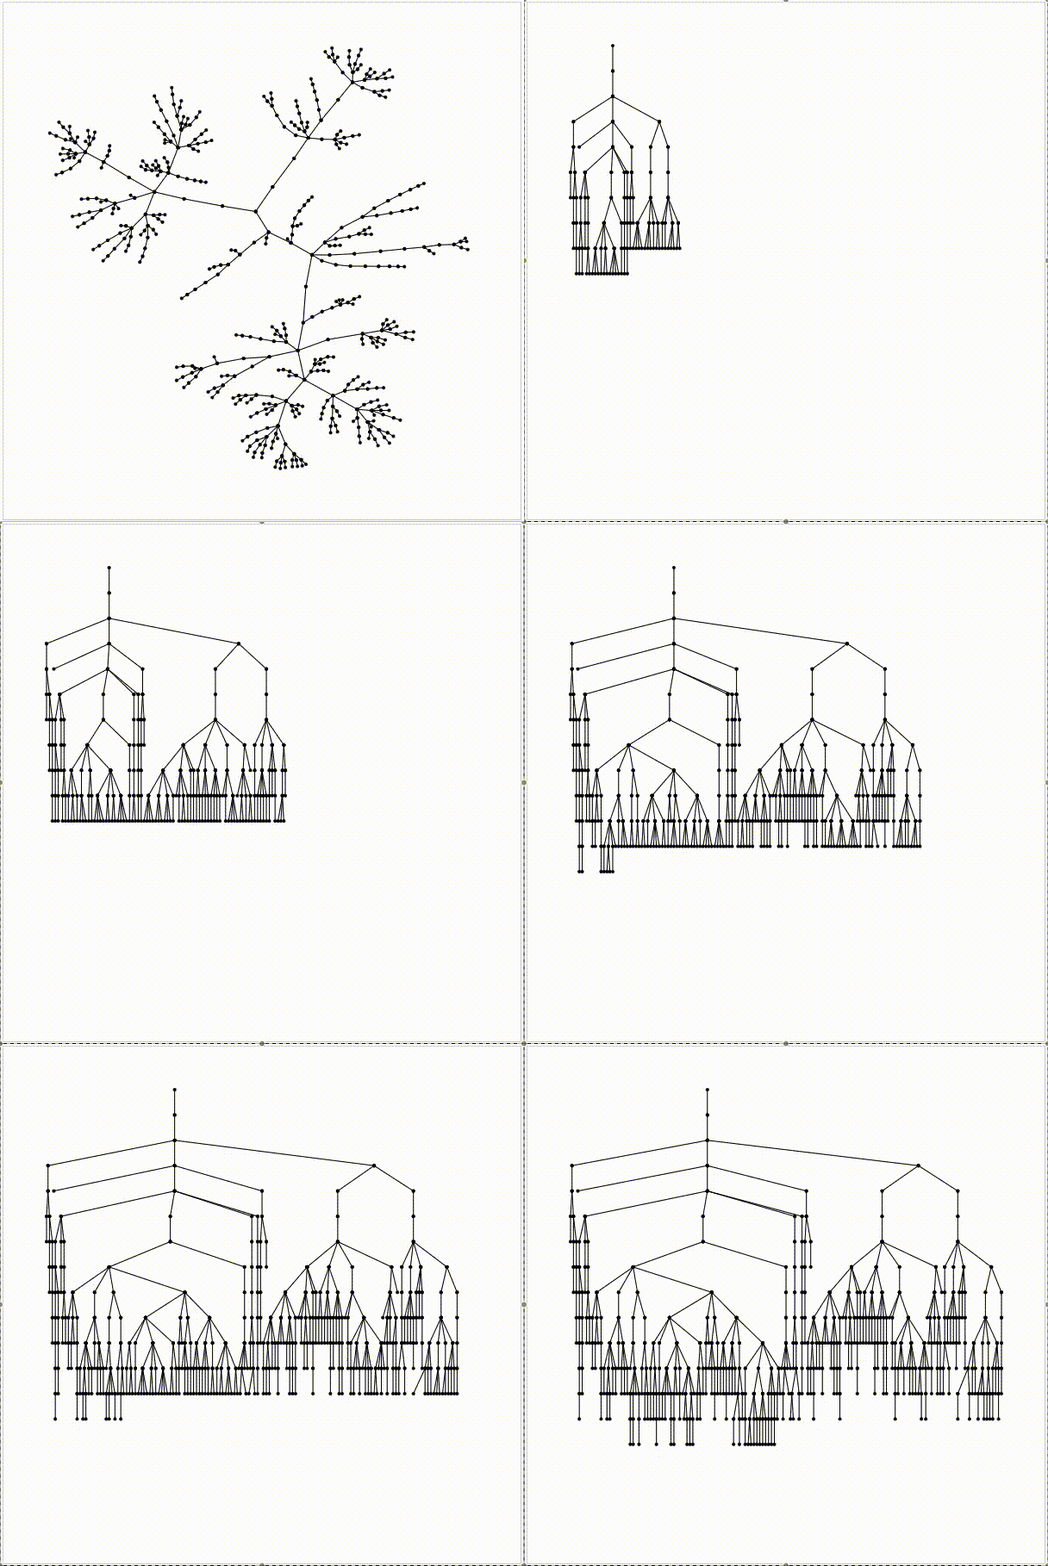
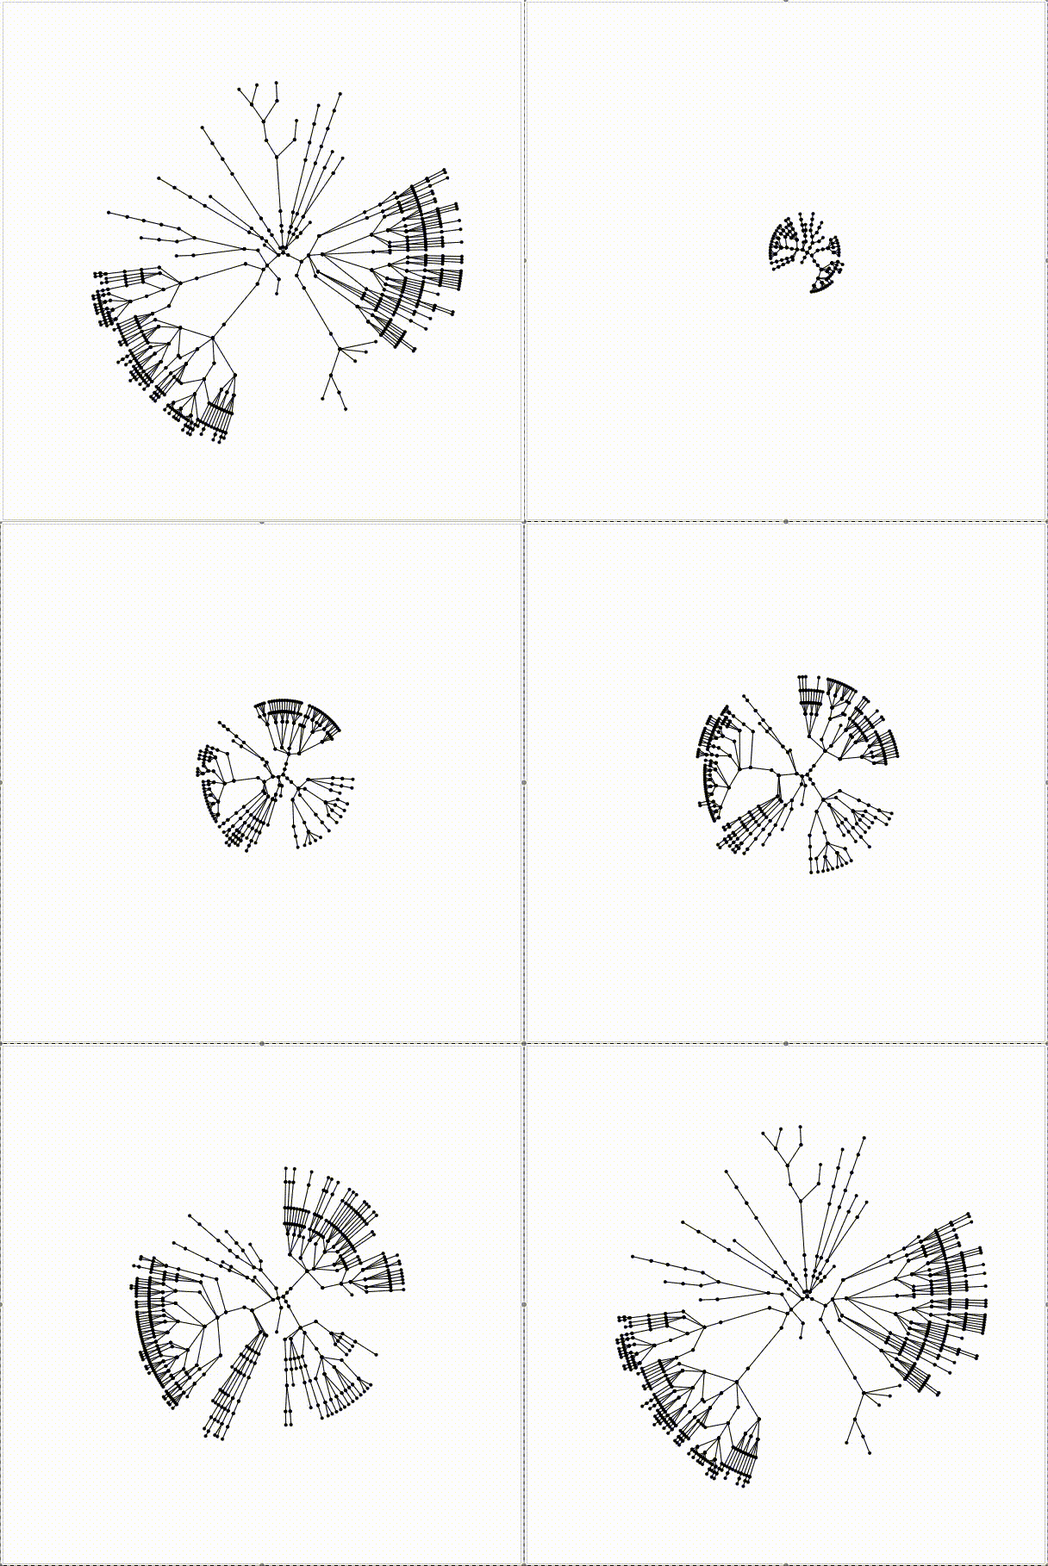
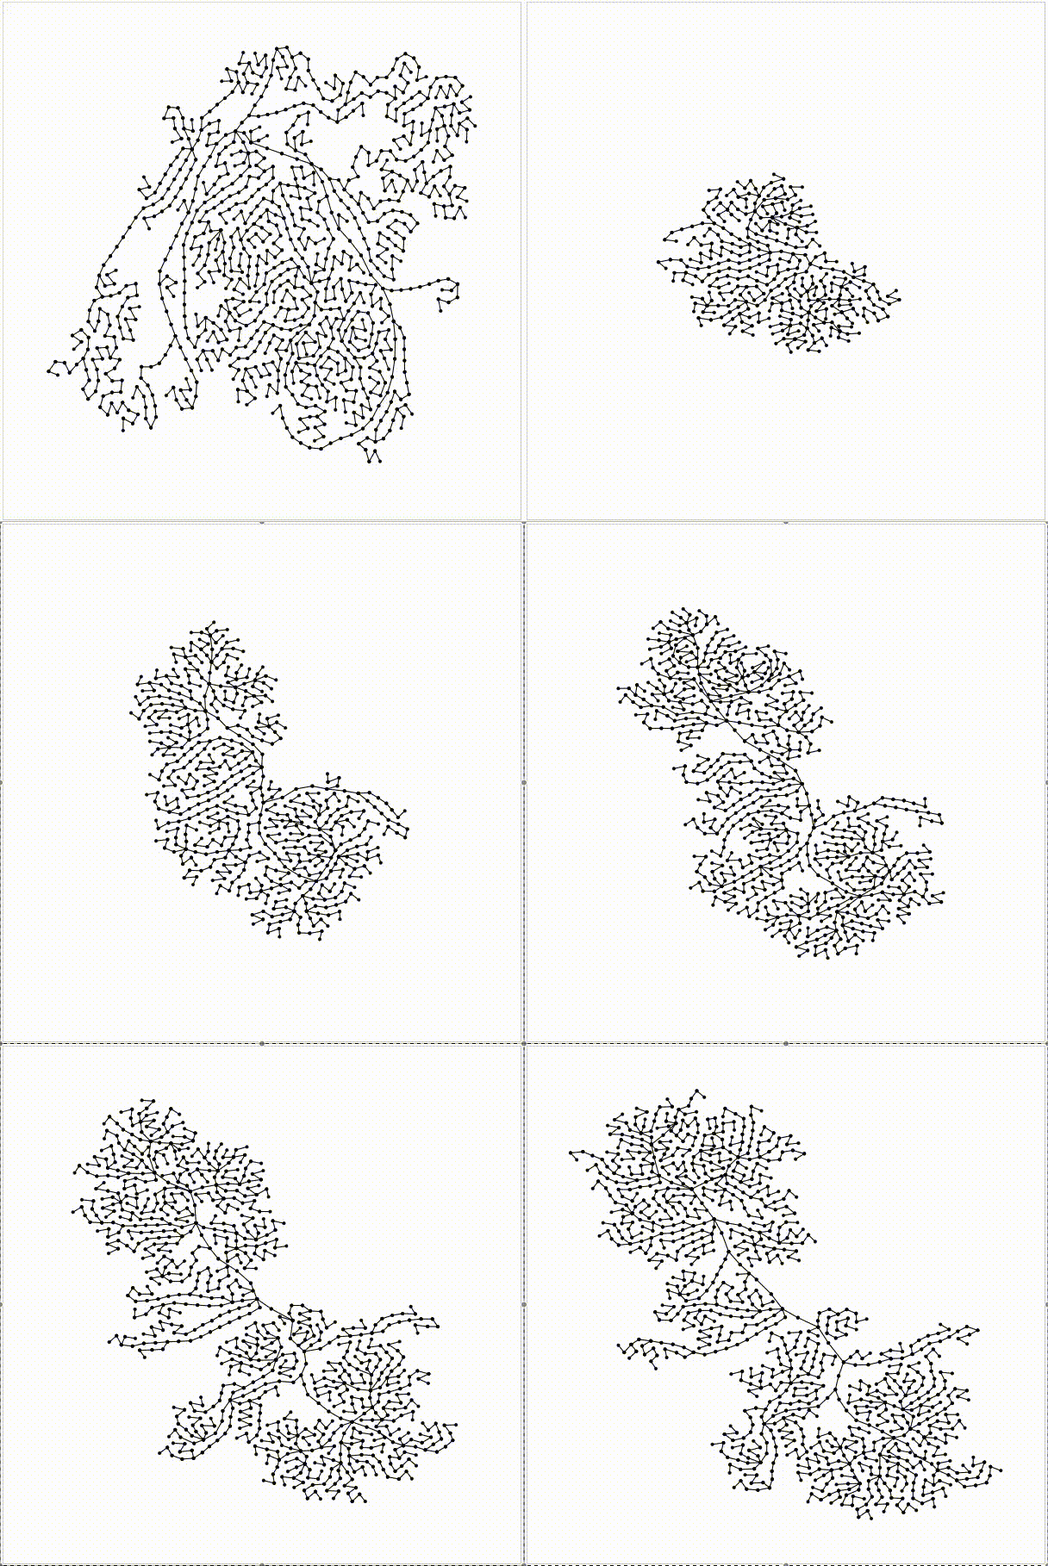
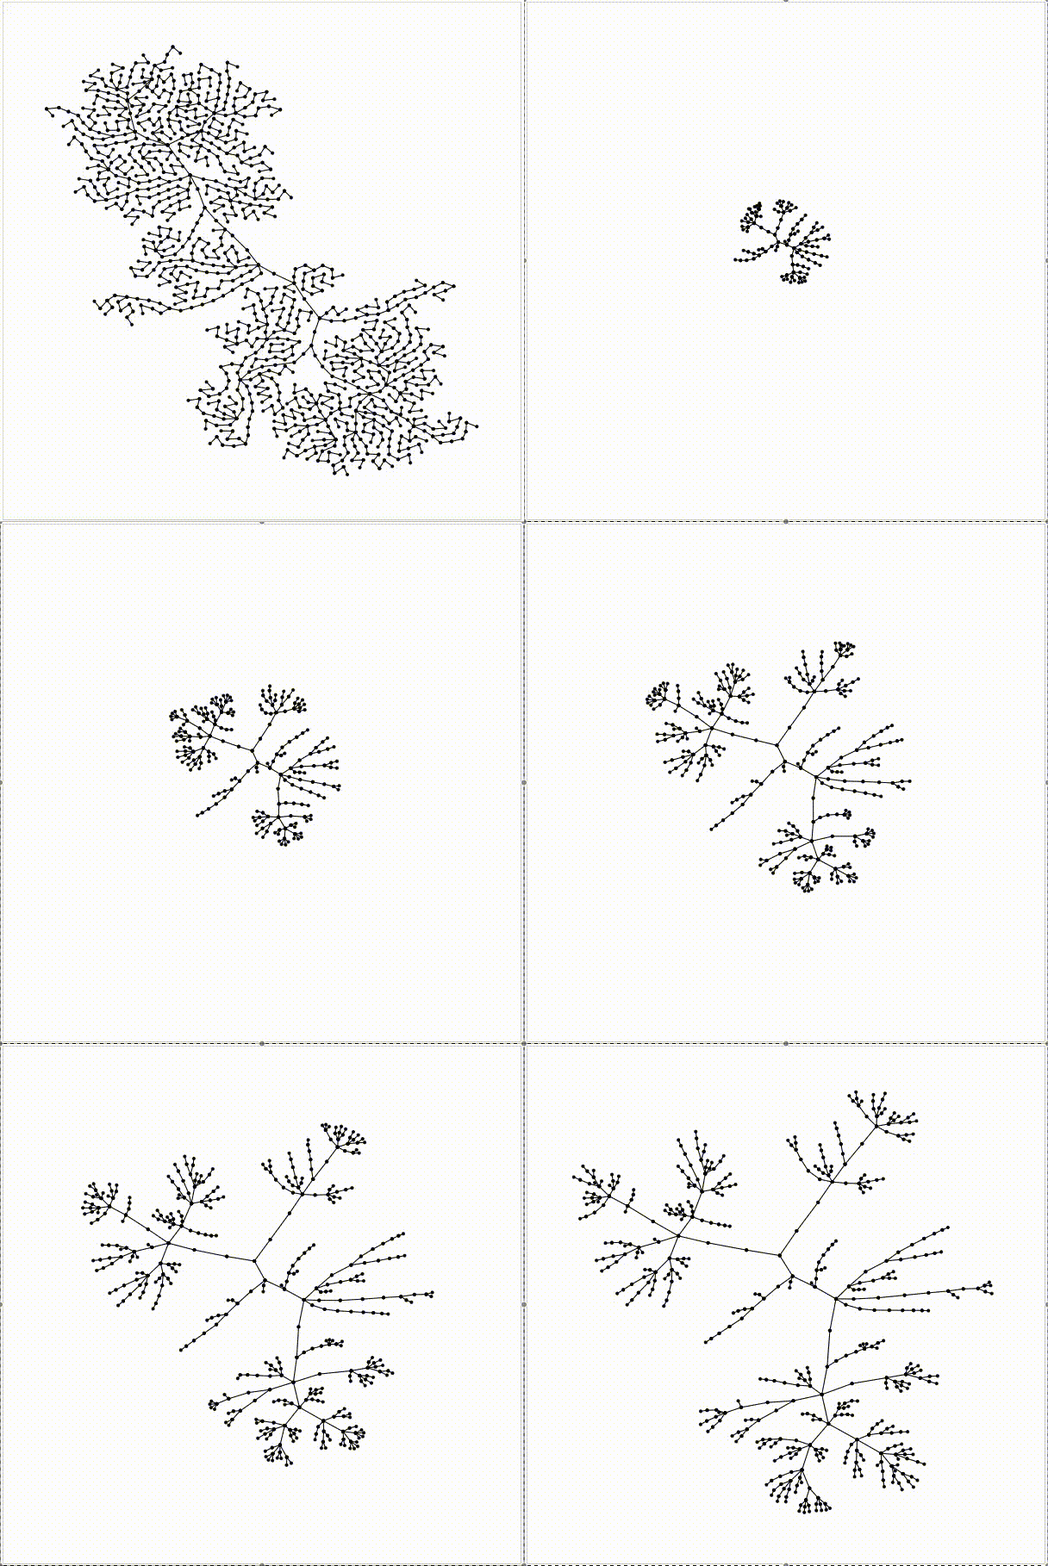
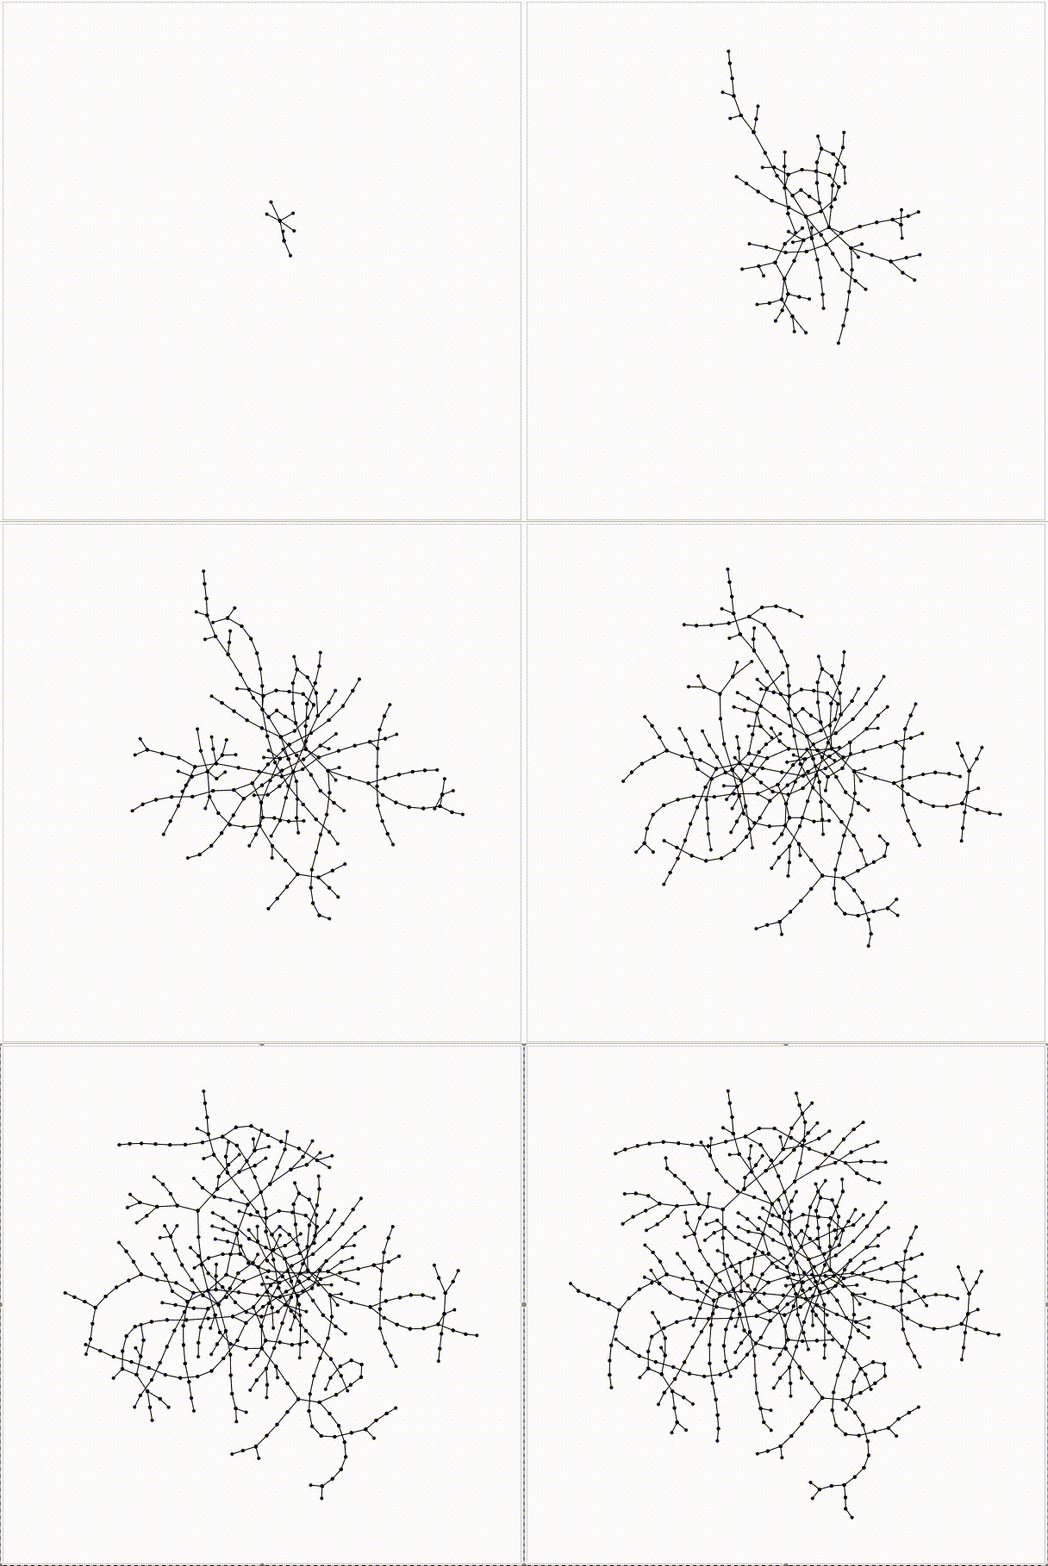
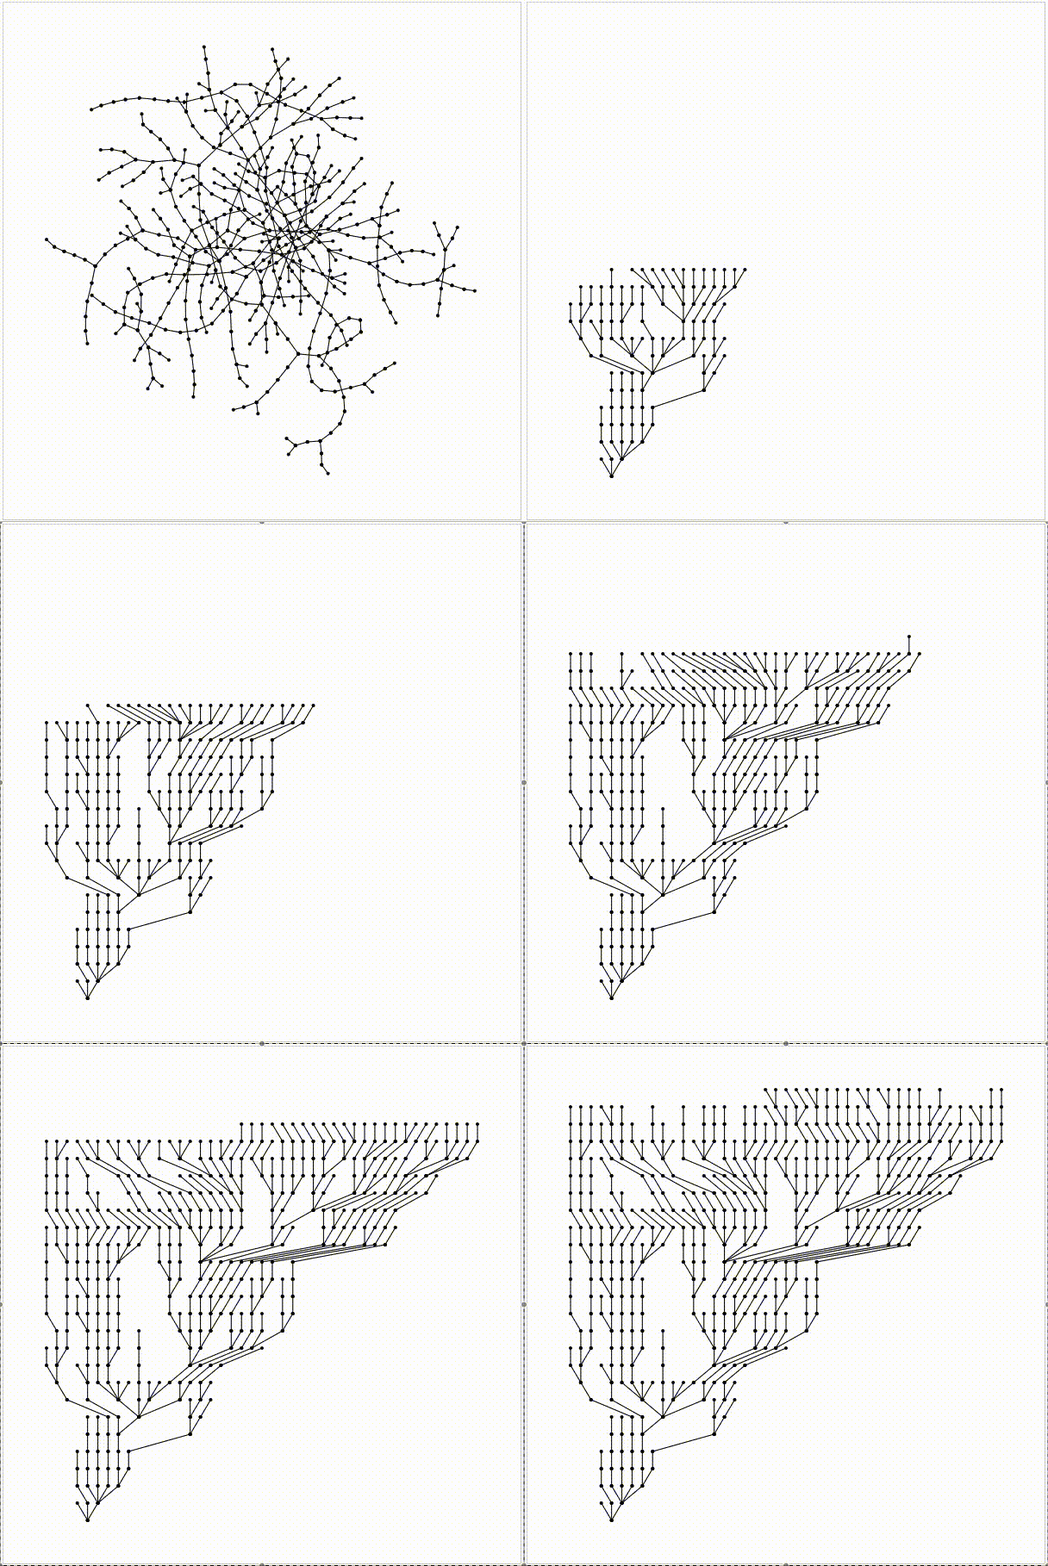
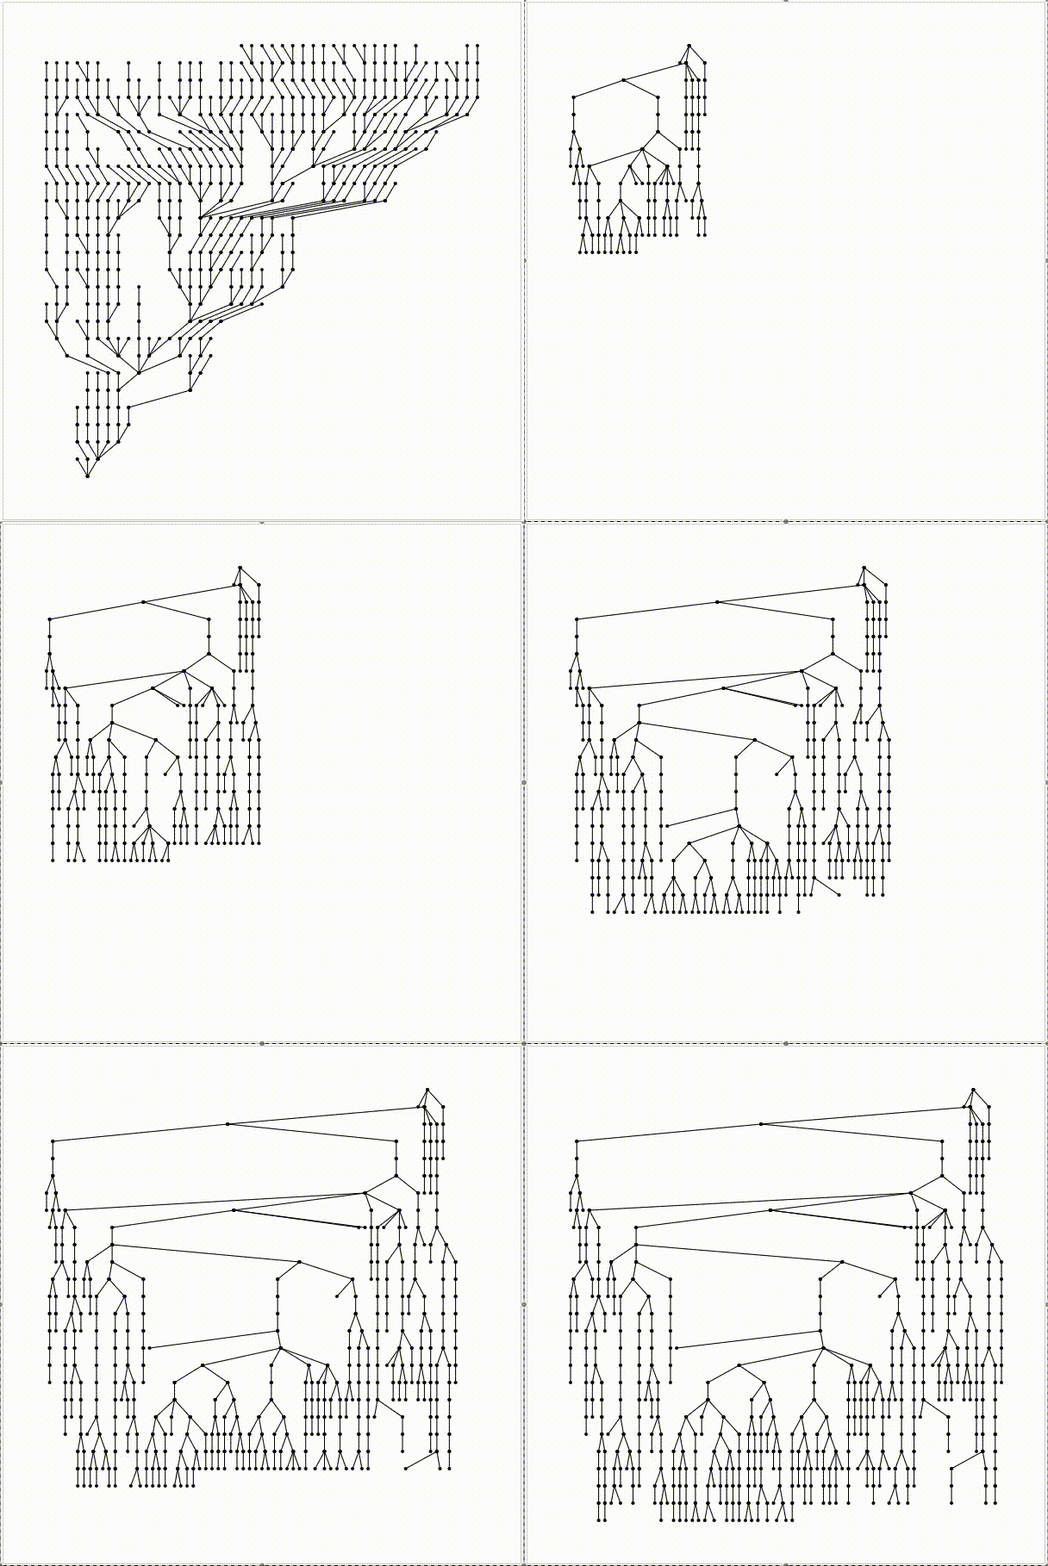
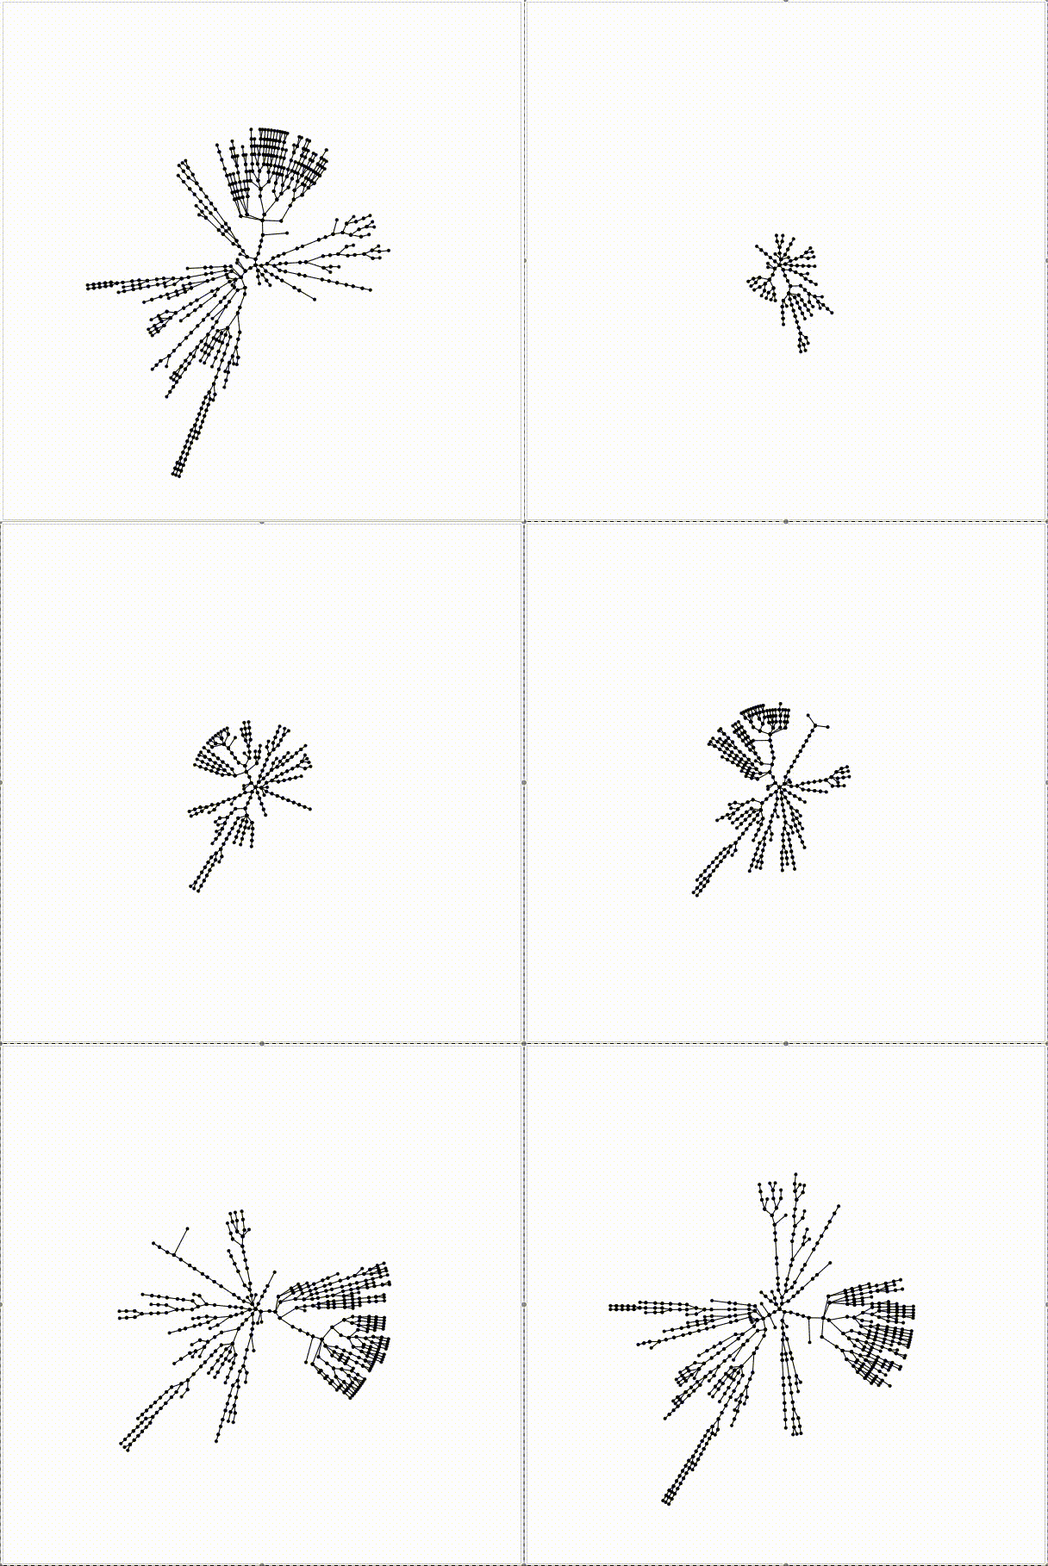
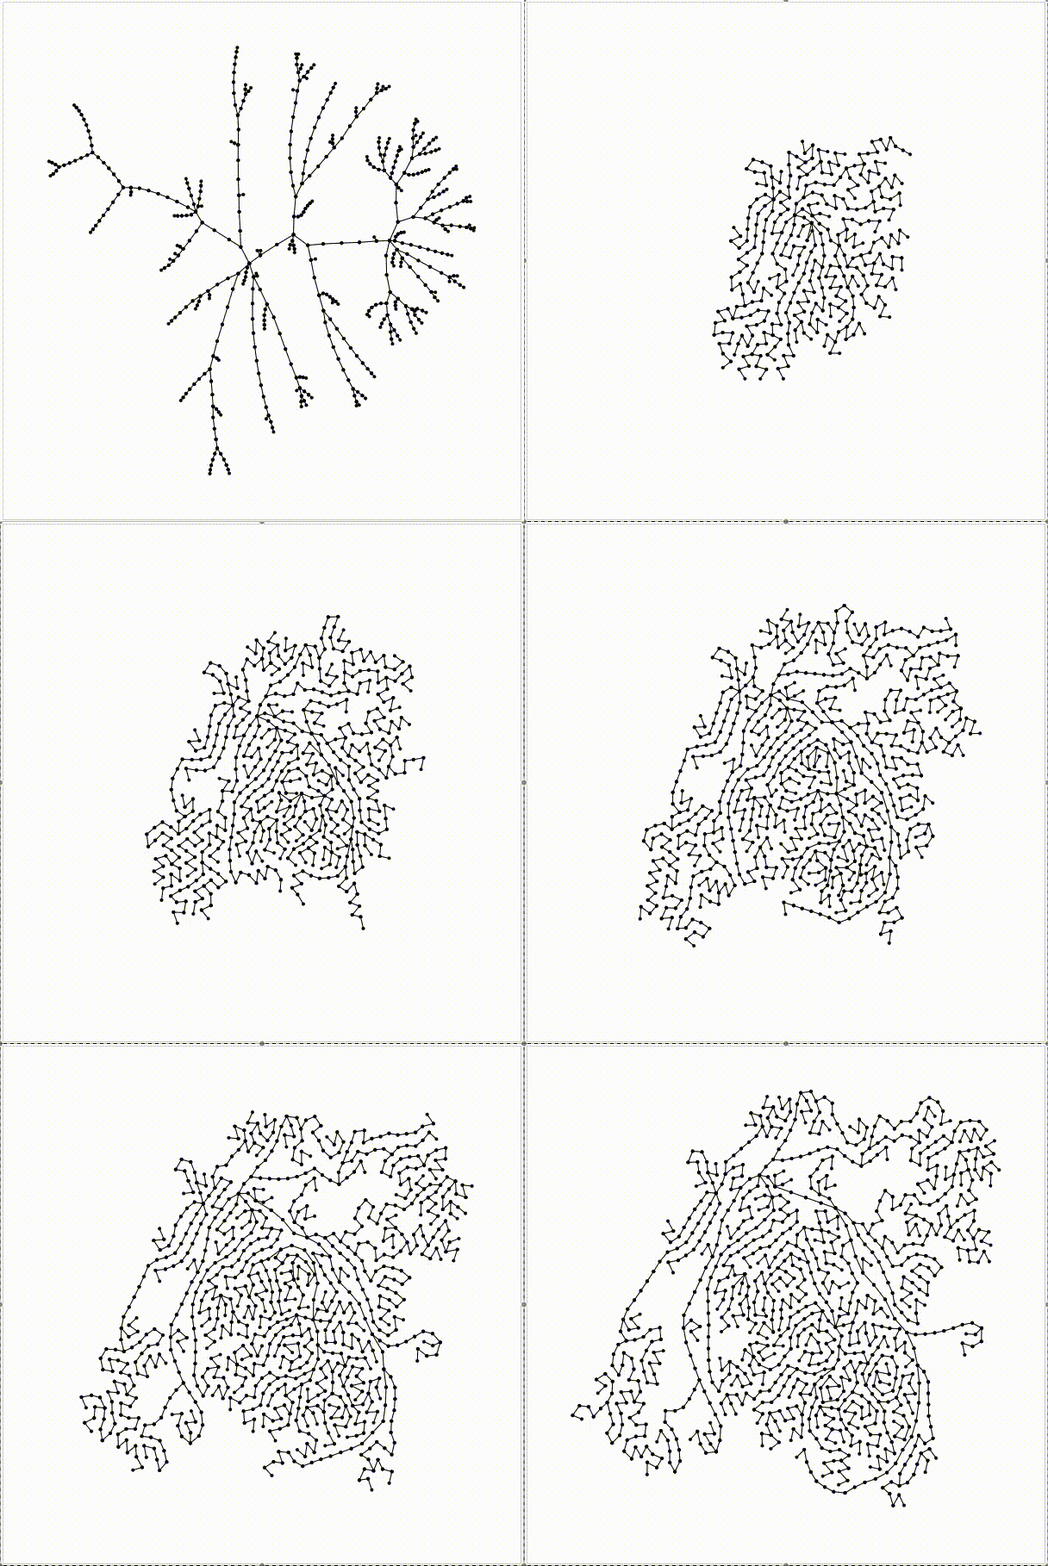
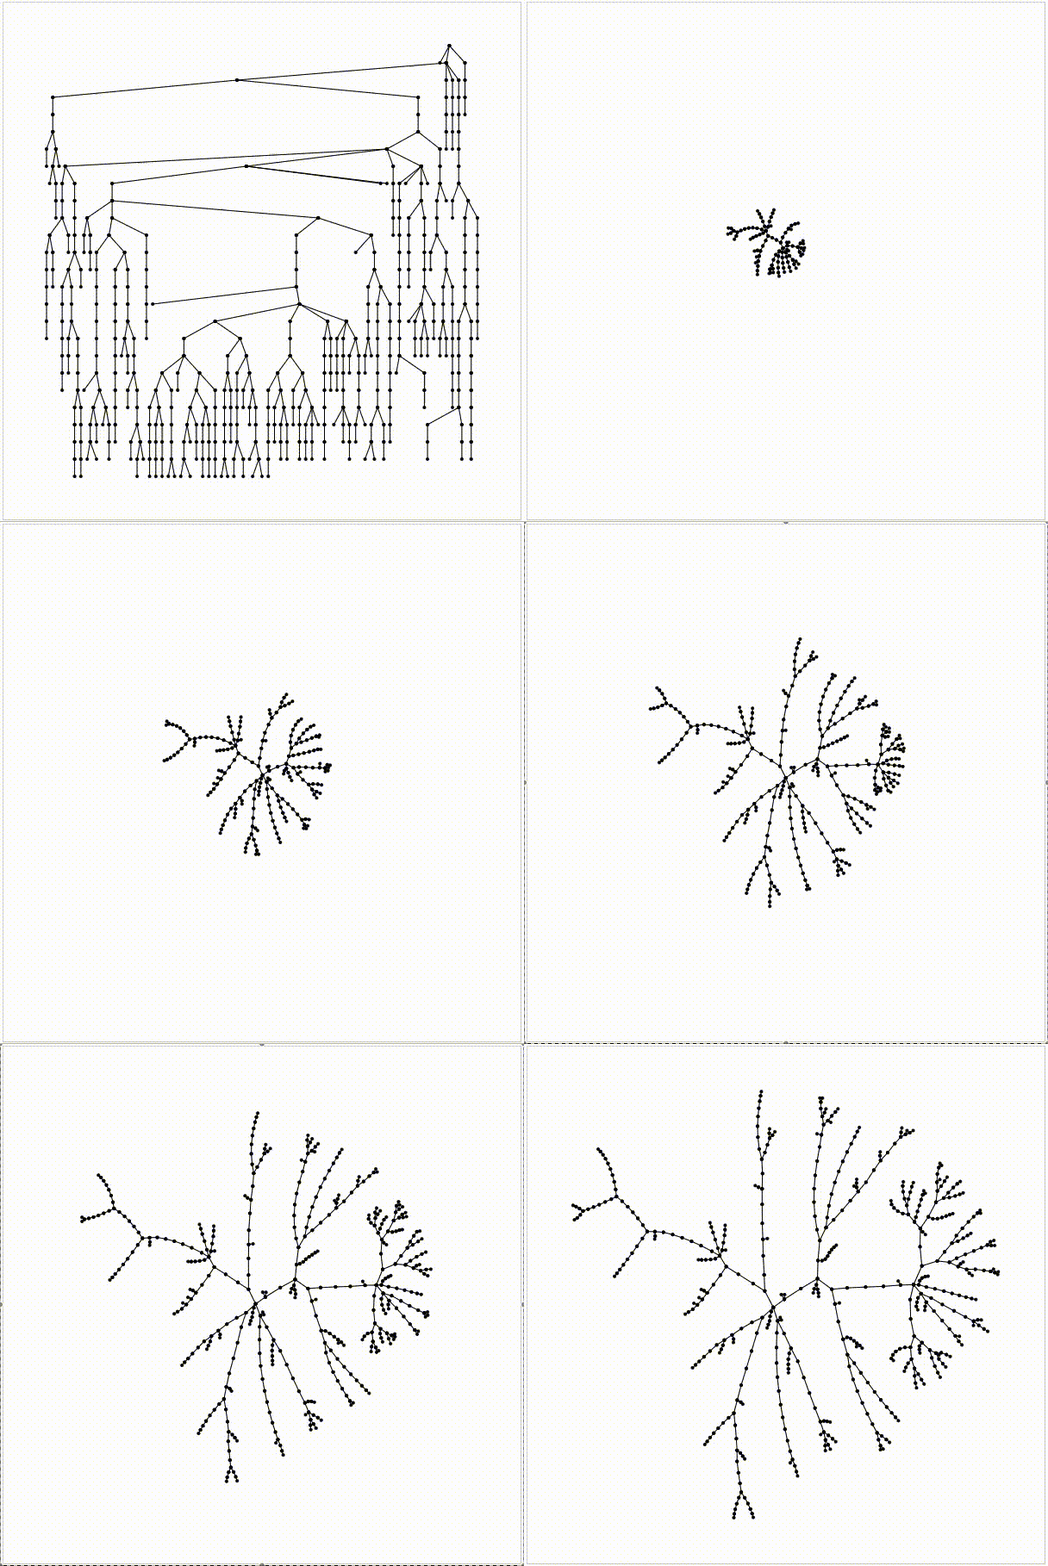
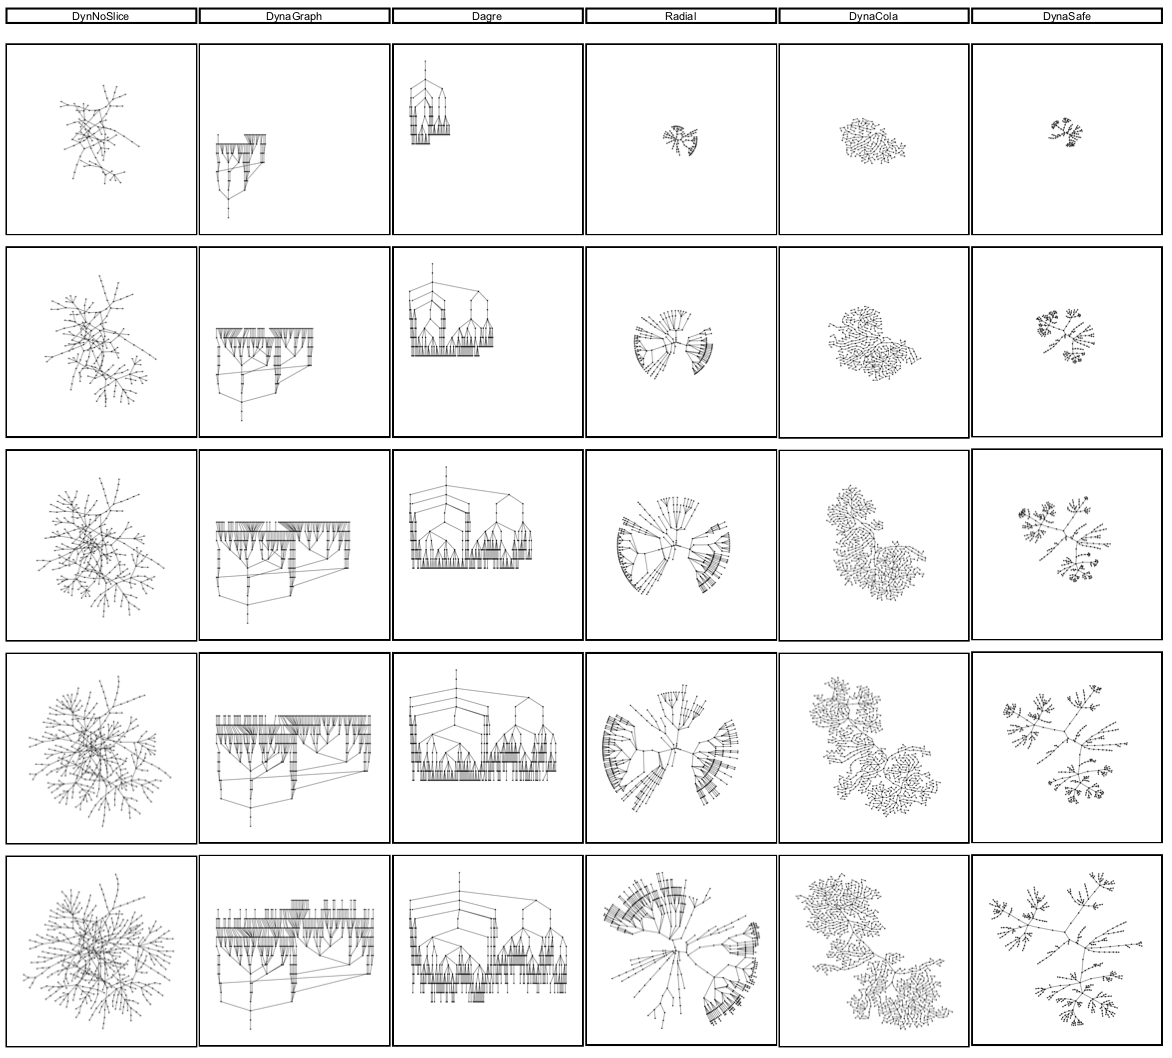
This website contains information regarding the paper 'Visualizing Evolving Trees'. Here we present ways to draw dynamic trees, where nodes are allowed to enter, but not leave. We present two different algorithms, DynaCola (Dynamic Collision) and DynaSafe (Dynamic Safety) that draw these trees without crossings and with good compactness.
Math Geneology
This graph, found here: shows advisor-advisee relationships in the world of mathematics, stretching back to the middle ages. The dataset includes the thesis titles, students, advisors, dates, and number of descendants. The total number of nodes is around 260,000 and is continuously updated. While this data is not quite a tree (or even connected, or planar), we extract a subset to create a tree with 500 nodes. The maximum node degree of this tree is 5 and the radius is 14.
Tree of Life
This graph, found here:
, captures the evolutionary progression of life on Earth.The underlying data is a tree structure with a natural time component. As a new species evolves, a new node in the tree is added. The edges give the parent-child relation of the nodes, where the parent is the original species, and the child is the new species. We use a subset of this graph with 500 nodes. The maximum node degree of this tree is 5, and the radius is 24.
